1 Introduction
This chapter aims to give a general introduction to the research project and put it into wide scientific and societal context. It defines the main research question and the hypothesis, and gives a high-level overview of the proposed framework. It also provides the links to the original datasets and the code.
1.1 Context
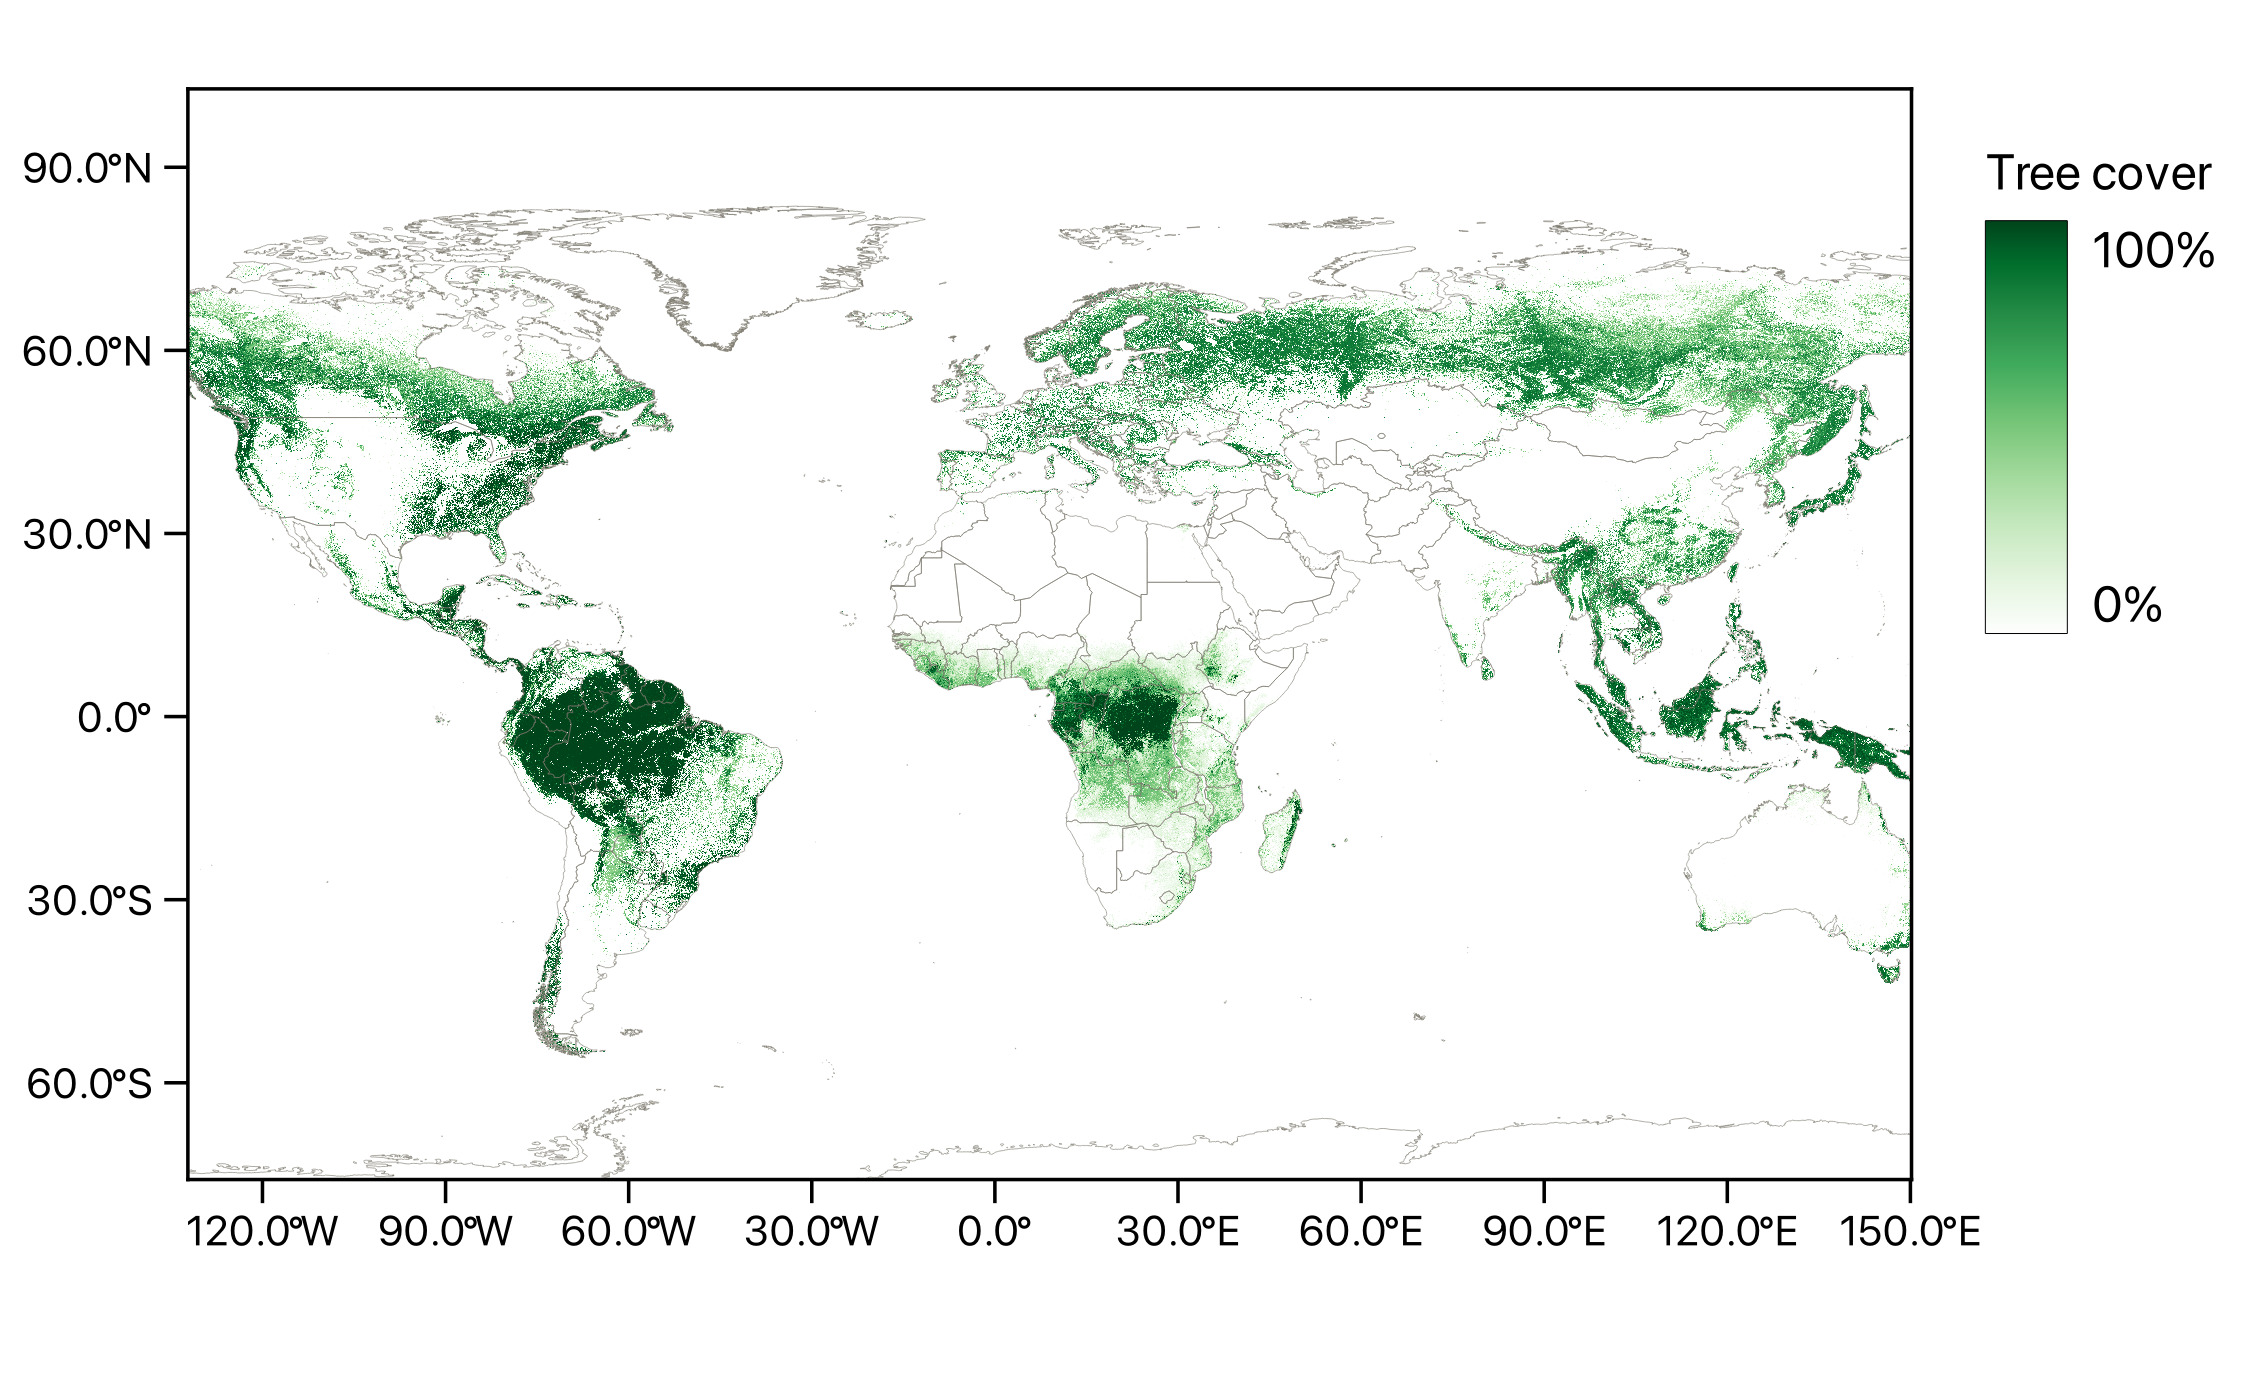
Forests are a crucial part of the global ecosystem, both environmentally and economically. They cover a third of the land area, contain over 80% of terrestrial biodiversity, and somewhere around one-third of humanity depends on forests and forest products for their livelihoods (Aerts and Honnay 2011; The State of the World’s Forests 2020). Forests are an essential renewable natural resource and a huge, dynamic part of the global carbon cycle. Figure 1.1 offers a map of the global tree coverage based on data from Hansen et al. (2013) to highlight the extent of forests on the planet. Responsible management of forests allows using the resources efficiently and sustainably, preserving the biodiversity, and regulating atmospheric \(CO_2\), which is becoming especially important as the anthropogenic climate change is ongoing and accelerating (Fahey et al. 2010; Forster et al. 2024). This drives the need for accurate, detailed, up-to-date information about various forest attributes such as distributions of tree species, average heights and ages of trees, estimates of trunk diameter, timber volume, and above ground biomass, and others.
The traditional manual forest inventories that rely on people going out into the forest to count and measure trees will always remain the most reliable and accurate way to assess forest parameters (Burley, Youngquist, and Evans 2004). However, they are also extremely labor-intensive and time-consuming, which makes them infeasible to cover extensive areas with sufficient detail, speed, and frequency. They will always be required for quality assessment and validation of any indirect method of estimating forest parameters through remote sensing, but better methods of estimation will help to reduce these the time and effort. This is especially relevant in countries where massive areas are covered by forests, such as Russia, Brazil, Canada, USA, and China, which are the top five countries for forest area according to Global Forest Resources Assessment (2020). For that reason, various remote sensing techniques are widely used to extend and extrapolate the traditional forest inventories. All sorts of data, from satellite and aerial imagery to very detailed terrestrial LiDAR (light detection and ranging) surveys, are used in all sorts of applications that require mapping forest attributes. Some such applications are mentioned in the next chapter dedicated to reviewing the literature.
Many national space agencies provide open access to satellite data that can be used for mapping forests. European Space Agency offers free and open access1 to the Sentinel missions through its Copernicus Data Space Ecosystem platform, including C-band SAR data from Sentinel-1 and medium-resolution multispectral data from Sentinel-2, both with global coverage. They also have an upcoming P-band SAR mission called BIOMASS, designed specifically to study global forest biomass and carbon cycles (Quegan et al. 2019), which further indicates the growing importance and interest in the topic of forest mapping. NASA provides free access to an abundance of satellite data through its Earthdata platform, Landsat mission with the Operation Land Imager (OLI) instrument and Terra mission with the Moderate Resolution Imaging Spectroradiometer (MODIS) instrument being the most relevant for forest mapping applications. The Indian Space Research Organisation (ISRO), Brazilian National Institute for Space Research, National Space Research and Development Agency of Nigeria all offer free satellite data that can be used for this purpose. NASA and ISRO also have a joint upcoming mission called NISAR with two fully-polarimetric SAR sensors at L-band and S-band (Kellogg et al. 2020), which will benefit forestry applications greatly.
The open satellite data is an essential tool for wide-area studies, but it usually has coarse resolution (tens to hundreds of meters per pixel), which limits the achievable accuracy and level of detail. It also offers no ability to control the observation parameters, as they are fixed by the instrument configuration and orbit parameters, both of which are outside the data consumer control. Higher resolution data with a limited ability to control the acquisition parameters is available commercially, but the prices are steep. Aerial observations with sensors mounted on planes or helicopters are both more controllable and cheaper alternatives, although still expensive and sill limited in the flexibility of the control of acquisition parameters. A much more affordable and controllable alternative is UAV-based observation. It allows for fine-grained control and on the fly adjustment of many important parameters such as flight height, flight path overlap, combination of used sensors, and so on.
The most common way to use UAV remote sensing, be it LiDAR, multispectral, hyperspectral, or other data modalities, for mapping forest attributes in industry is what is known in the LiDAR community as the area-based approach, described in detail in Section 2.3. It is based on extrapolating measurements from ground plots made in traditional inventories by aggregating remote sensing data to the grid with cell area of a ground plot, which results in coarse resolution maps. It is easy to use, but its results are often not detailed enough when working on finer scales. However, modern sensors and processing techniques allow working on the level of individual trees without any aggregation on data level. This is as detailed as a survey can possibly get, allowing for any level of aggregation for downstream tasks. This requires robust algorithms that allow detecting individual trees in dense multimodal data. The task is relatively2 easy in urban environments, manually planted and managed forest stands, or forests that are either sparse or predominantly coniferous, where the structure of the canopy is easy to interpret. In some such environments, state-of-the-art results can be achieved by simple local maxima detection algorithms, that rely on the assumption that a tree can be detected by finding peaks of canopies because they correspond to tree tops. Forest that are mixed and dense, which are a huge part of forests in countries mentioned earlier, are much harder to work with and are a very active area of research for developing methods of detection of individual trees. The canopies in such forests are very complex, especially because the top of the crowns of deciduous tree species often do not have a single pronounced height maximum, and crowns of nearby trees often overlap.
The framework described in this thesis focuses on the fusion of two remote sensing data sources, UAV LiDAR point clouds and UAV RGB orthophotos, to detect individual trees in dense mixed forests and predict required attributes for each tree individually, producing the most detailed maps possible. The choice of data sources is driven by their complementary nature, which is key for semantically parsing such complex environments. LiDAR is an active sensor, which means it does not depend on external conditions such as lighting. Cloud and terrain shadows, incidence angles, and weather conditions do not affect LiDAR surveys. Moreover, LiDAR provides 3D vertical structural information about the forest, as laser pulses penetrate the canopy and reach both the undergrowth and the ground. This structural information is essential for understanding complex environments like dense forests. High-resolution RGB imagery does depend on the illumination conditions, but is still an invaluable tool, as it offers detailed data with fixed resolution, continuous coverage of surfaces, unlike the discrete representation of laser scanning, and captures many fine details and textures. It can also benefit from a huge variety of well-established tools and processing techniques from the field of computer vision. Neither of these data sources on their own is enough to reliably and with sufficient robustness separate individual trees in dense mixed forests, and the key to success lies in their fusion.
According to the Design Research Methodology framework (Blessing and Chakrabarti 2009), this research project can be classified as type 3: Development of Support. The Descriptive Study I is review-based, as understanding of the existing situation is obtained primarily from the literature review, and the most focus is on the comprehensive prescriptive study, followed by an initial Descriptive Study II to evaluate the results.
1.2 Research question and hypothesis
The main research question could be formulated as follows: “How to reduce effort and cost required for detailed inventories of dense mixed forests without losing accuracy?” The main hypothesis is then: “An accurate and detailed inventory with reduced effort and cost can be achieved through fusion of UAV LiDAR and RGB data using machine learning”. The benchmarks to measure against are both the traditional manual forest inventory and the widely used area-based approach.
Cost and effort are closely connected, as any effort is in the end converted to cost. Still, it often makes sense to separate the two to highlight the nature of the effects the proposed system should have. The cost reduction was partly addressed in the previous section during the discussion of the platform of choice: UAV-based remote sensing offers a great balance of upfront cost, effort to operate, and versatility in observation parameters. The effort reduction comes from greatly decreasing the amount of field inventory data required when using the proposed system, from the relative ease of collection of remote sensing data compared to alternatives, and from relative ease of tuning the system to operate in new areas.
1.3 Overview of the framework
The thesis describes a framework – details a possible way that a system for estimating forest parameters on the scale of individual trees can be built, with a relatively accessible amount of data and effort. Potential ways to create all the components a system like that needs are described, as well as the way they are assembled into a complete system. The heart of the proposed approach is the reduction of effort required for data collection for training a tree segmentation model. It is achieved by circumventing the need to create very labor-intensive datasets of fully segmented point clouds of forests where each point is assigned an ID of the tree it belongs to by using a significantly easier to create data of individual trees extracted from a larger point cloud of a forest. The individual trees are then arranged into synthetic forest patches, in which the per-point tree ID labels arise naturally from ordinal numbers and positioning of the trees within a patch, creating a reasonable alternative to manual segmentation.
The proposed framework consists of neural network-based tree segmentation in UAV LiDAR point clouds enhanced with RGB orthophoto-based features, with further processing of the segments using a collection of specialized classic machine learning models that predict the parameters of interest for each detected tree. The tree segmentation model is trained on synthetic forest patches constructed from a dataset of point clouds of individual trees extracted manually from a large UAV LiDAR survey, heavily relying on augmentations to make the synthetic forest closer to the real forest. The parameter prediction classification and regression models are trained on the same dataset of individual trees, each specializing in a single parameter of interest that is available for the extracted tree – species, dbh, etc.
The most important parts of the framework are the approach to generation of data for training the tree segmentation network and the arrangement of the components into a single system. All other components can be swapped with different ones that serve a similar purpose. In fact, as mentioned in Section 5.1, such replacement are encouraged to improve the system. For example, the example implementation described in the thesis uses PointNet++ as the backbone for the segmentation network, but any other architecture that can operate directly on point clouds and output per-point predictions can be used instead. Using a more modern and powerful architecture will be beneficial, as the PointNet++ was chosen for ease of implementation and experimentation. Similarly, the specialized parameter prediction models in the example implementation are Random Forests trained using a collection of widely used manual point cloud features. Models trained on better feature sets, or any other models that can reduce a point cloud to a single prediction can be used instead, even neural network ones, even though the source dataset will probably need to be considerably larger for training even a small network.
Figure 1.2 is a schematic representation of the framework, showing the required inputs in red, processing steps in yellow, and artifacts in cyan. The field inventory is phased out, but it is still required, as application of any framework requires quality assessment and validation. The system consists of a trained tree segmentation neural network and a collection of trained attribute prediction models. The inputs for the framework are a UAV LiDAR point cloud and an RGB orthophoto. The point cloud is preprocessed by removing duplicates and noise points, classifying the ground points, and normalizing height. The orthophoto is processed by a feature extractor that encodes context information, and the planar coordinates of points of the point cloud are used to sample the orthophoto to combine both data sources into one. The tree segmentation neural network is then applied to the augmented point cloud to separate it into individual trees. The segments are then processed by a collection of specialized models, each predicting a single parameter of interest, like tree species, diameter at breast height, or others. The overall results are both the map with locations of individual trees, that can be created by reducing the segments into single planar points, and the required predictions of the parameters for each of the trees.
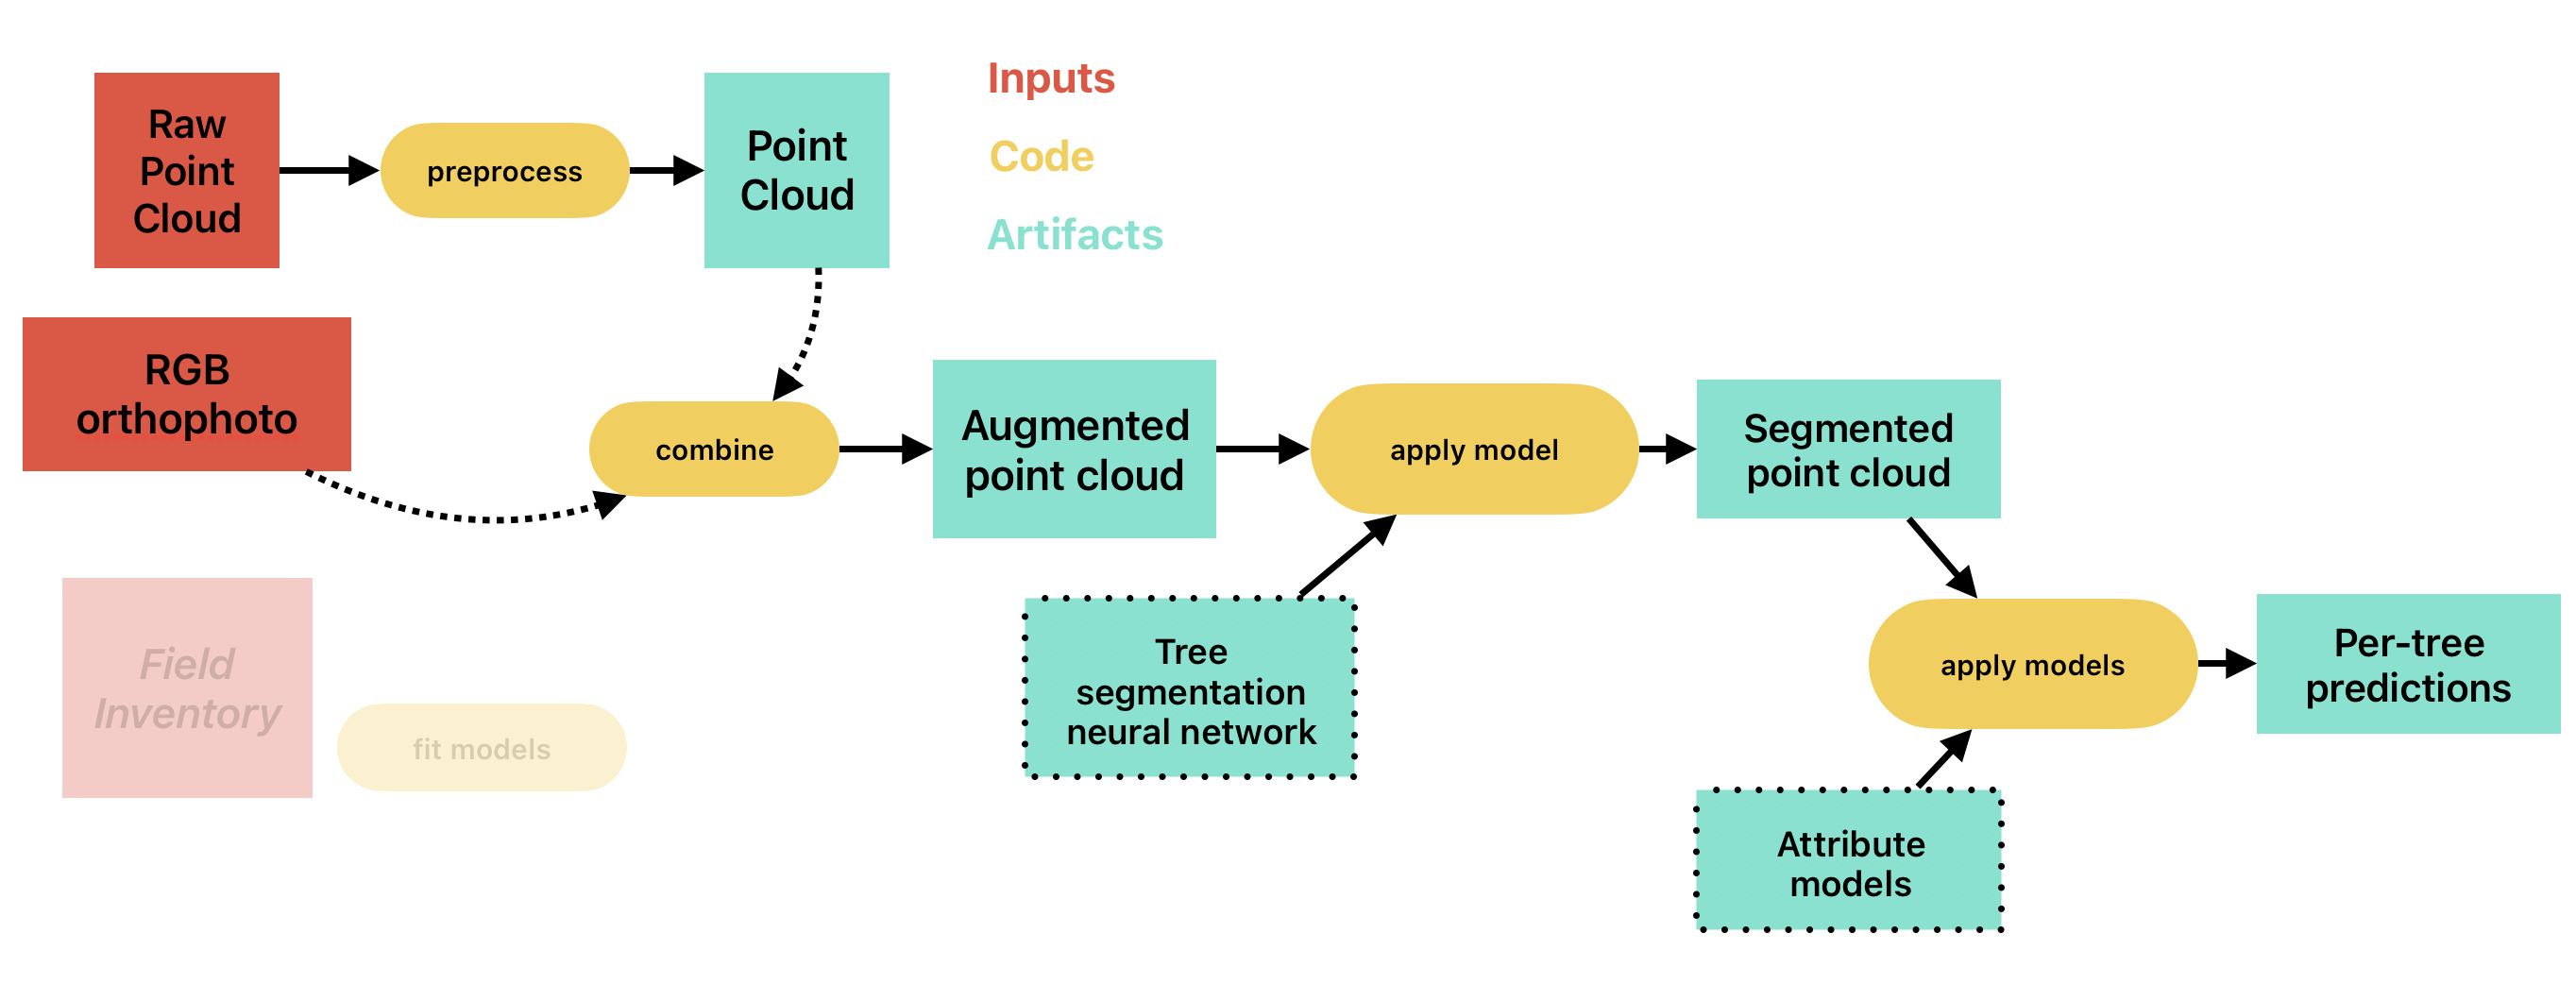
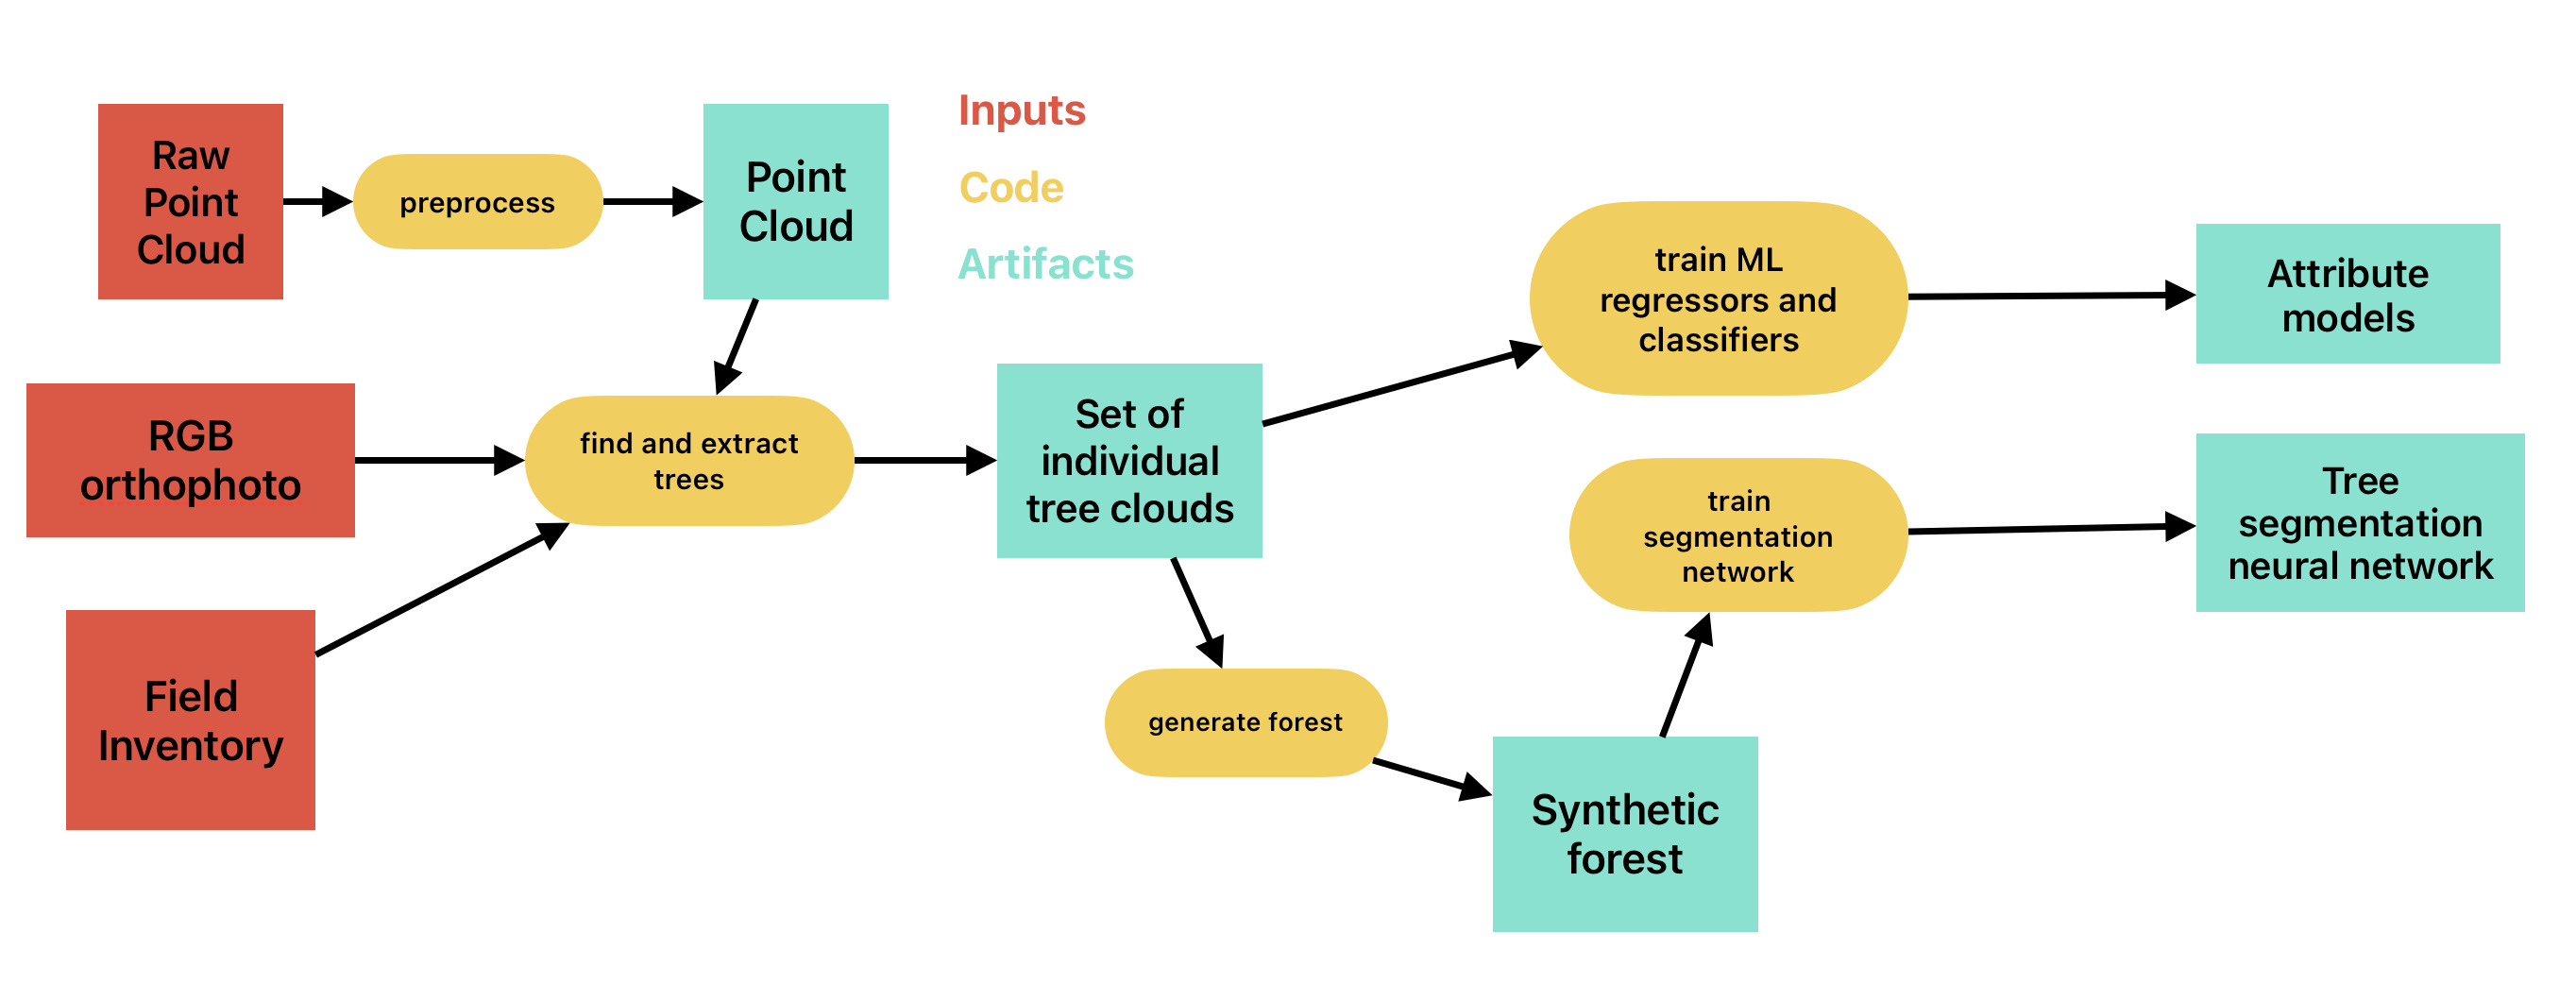
Figure 1.3 is a schematic of the preparation step for the framework. Each individual node is described in detail in Chapter 3. To create a working implementation, a manual forest inventory covered by a UAV LiDAR point cloud and an RGB orthophoto are required. The inputs are used to create a dataset of point clouds of individual trees – which is significantly easier than to fully segment the point cloud into individual trees. This dataset is then used for generating synthetic forest patches for training the neural network and for training the tree parameter prediction models. The trained models are then used during inference as described in the previous paragraph.
1.4 Thesis structure
The thesis consists of 5 chapters. This section briefly describes the contents and aims of each one.
Chapter 1 aims to give a general introduction to the research project and put it into a wide scientific and societal context. It defines the main research question and the hypothesis, and gives a high-level overview of the proposed framework. It also provides the links to the original datasets and the code.
Chapter 2 aims to give an overview of the scientific literature on topics most relevant to the project. Its main goals are to provide the reader with context for the research described in the thesis, provide references for in-depth materials on topics that are out of scope of this work, and to highlight the research gap that the work tries to address.
Chapter 3 describes in detail the datasets, methods and methodological choices used in the proposed framework. Its aim it to make the work reproducible and to explain the methodological choices made.
Chapter 4 describes the results of each stage of the framework preparation and the validation approach used to verify its applicability and effectiveness on realistic data.
Chapter 5 offers a brief summary of the thesis as a whole, potential approaches for further improvement of the proposed framework, and some concluding thoughts.
1.5 Data and code availability
Original datasets described in the thesis are openly available on Kaggle (Lysva field survey here and individual tree point clouds here). All the code used for the project is available on GitHub at iod-ine/phd. An HTML version of this thesis is hosted through GitHub Pages and is available here. The thesis document was developed using Quarto (Allaire et al. 2024) using the literate programming approach (Knuth 1984). The deep learning part is implemented using PyTorch (Ansel et al. 2024), PyTorch Geometric (Fey and Lenssen 2019), and PyTorch Lightning (Falcon and The PyTorch Lightning team 2019), with experiment tracking using MLflow. Classic machine learning models implementations are from scikit-learn (Pedregosa et al. 2011). NumPy (Harris et al. 2020), SciPy (Virtanen et al. 2020), pandas (The pandas development team, n.d.), scikit-image (van der Walt et al. 2014) libraries are used for processing the data. ratserio (Gillies et al. 2013/), geopandas, laspy, lazrs libraries are used for working with geospatial data formats. matplotlib (Hunter 2007) and seaborn (Waskom 2021) libraries are used for visualization.
Although the access is not open for everyone equally, as I have observed silent bans of the accounts connecting from Russian IP addresses without any response to support inquires in the previous platform, and an outright IP ban in the current one.↩︎
The word relatively does a lot of heavy lifting here, as the problem is by no means easy on its own and takes a lot of effort from many researchers to continue to make progress on.↩︎